

Archive position — measured, not model output
0 likes on Devpost
2,263 of the 7,850 archived projects have more likes, and 5,587 share exactly 0 — so this project's #7,630 place in the like-ranked listing is a tie-break inside that group, not a ranking.
Projects (log scale)
Likes on Devpost. ▲ marks this project's group.
Show the figures
| Likes | Projects | Share of archive |
|---|---|---|
| 0 | 5,587 | 71.2% |
| 1 | 1,758 | 22.4% |
| 2 | 284 | 3.6% |
| 3–4 | 132 | 1.7% |
| 5–9 | 75 | 1.0% |
| 10+ | 14 | 0.2% |
 User Stories BotA demo video on every pull request
Get a demo video on every new feature
GitHub App that watches your pull requests and records a narrated, captioned demo.
Save time on demo prep and make informed decisions faster with a video walkthrough of every new feature.
Executive Summary
What the company appears to be
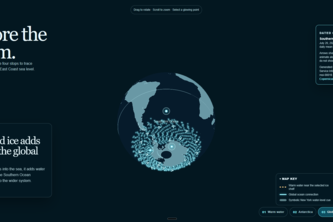
Warm Antarctica is an interactive 3D climate-learning map built as a hackathon project. The description states it visualizes how warm ocean water can weaken Antarctic ice shelves, how grounded ice contributes to global sea level, and why New York is affected.
What changed
This is a self-reported project submitted to the OpenAI 2026 hackathon. No evidence of product development beyond this submission, no commercial activity, no customers or revenue.
Single most important open question
Is there any evidence of traction, adoption, or commercial viability beyond this single author-built prototype?
What The Product Actually Is
The description states that Warm Antarctica is an interactive 3D climate-learning map. It allows users to rotate a globe, select glowing locations, or follow a guided journey through four connected ideas:
- Relatively warm ocean water can reach Antarctic ice shelves.
- Ocean heat can thin floating ice shelves from below.
- When grounded ice moves into the ocean, it adds water to the global ocean.
- Global sea-level rise can contribute to sea levels in places far away like New York.
The product includes:
- A 3D globe visualization
- Four connected educational modules
- Scientific explanations linked to primary sources (NASA, NOAA, British Antarctic Survey, etc.)
- MapLibre GL JS for mapping
- React and Next.js for frontend
- Cloudflare-compatible deployment stack
Evidence The author's own description.
Inference This is a single-author educational visualization tool built as a hackathon project. It has no commercial or revenue-generating elements described.
Positioning & Claim Evolution
The author states that the goal was to create a learning experience that helps visitors see how warming of Antarctica can increase sea levels in places far away like New York, if we don't mitigate this issue.
The positioning is educational and climate-focused. It aims to show the connection between Antarctic ice loss and global sea-level rise, with a specific focus on making people understand the implications for distant locations like New York.
Evidence The author's own write-up.
Inference The project positions itself as an educational tool for climate literacy, not a commercial product or service. It does not claim to be a platform or marketplace but rather a visual learning experience.
Target Customer & ICP
The description states that the target audience is "visitors" and "learners" who want to understand how Antarctic ice loss affects global sea levels.
It's unclear if there are specific segments identified beyond general learners or students. The project appears designed for educational use, possibly in schools or public climate literacy programs.
Evidence The author's own write-up.
Inference The ICP is likely educators, students, or general public interested in climate science education. No evidence of a defined customer segment beyond "visitors" and "learners."
Business Model & Pricing Evidence
There is no evidence of any business model or pricing structure described. The project is presented as an educational tool built for a hackathon.
Evidence Not evidenced.
Inference No commercial activity, revenue, or pricing information provided. It's not clear if the author intends to monetize this product or if it's purely educational.
Technical & Delivery Signals
The project was built with:
- TypeScript
- React
- Next.js
- MapLibre GL JS
- Cloudflare Workers
- Codex and GPT-5.6 for development assistance
- NASA, NOAA, Copernicus Marine Service data sources
It includes features like:
- 3D globe visualization
- Guided journey mode
- Animated layers showing ocean currents
- Responsive controls
- Source links to scientific data
Evidence The author's own write-up.
Inference The technical stack suggests a modern web-based educational tool. It uses AI tools for development, and integrates with scientific datasets. No evidence of production deployment or scalability beyond the prototype.
Traction & Maturity Signals
There is no evidence of any traction, adoption, or user engagement beyond the single author's submission to a hackathon. The project has not been commercialized or deployed in any real-world environment.
Evidence Not evidenced.
Inference This is a prototype built for a hackathon with no signs of product-market fit, user base, or commercial traction.
Competitive Context
The description does not mention any competitors or direct market context. It's unclear if there are similar educational climate visualization tools in the market.
Evidence Not evidenced.
Inference No competitive landscape is described. The project appears to be a standalone educational tool without reference to existing products or services.
Open Questions & Risks
- No commercial viability: The project is presented as a hackathon submission with no evidence of monetization.
- Single author: Only one person built the entire product, suggesting limited scalability or team capacity.
- Educational focus only: No indication that this is intended to evolve into a commercial product or service.
- Unverified claims: All content is self-reported and unverified; no third-party validation of scientific accuracy or educational impact.
Evidence Not evidenced.
Inference The lack of any business model, traction, or team suggests low probability of commercial success. The project is not described as a scalable product or service.
Questions the description leaves open
- Is this project intended to be commercialized or scaled beyond the hackathon?
- Have you tested this with actual users or educators?
- What are your plans for ongoing maintenance, updates, or feature development?
- Are there any partnerships or funding sources that support further development?
- How do you plan to validate scientific accuracy in a public-facing product?
Overall Assessment
There is no evidence of a commercial business model, revenue, customers, or traction beyond the single author's hackathon submission.
Evidence Not evidenced.
Inference This is not a viable investment or partnership opportunity at this stage. It is a prototype educational tool with no indication of commercial viability or scalability. The project does not appear to be a product in development but rather an experimental educational visualization.
User Stories BotA demo video on every pull request
Get a demo video on every new feature
GitHub App that watches your pull requests and records a narrated, captioned demo.
Save time on demo prep and make informed decisions faster with a video walkthrough of every new feature.
Source
Submitted to the OpenAI 2026 hackathon on Devpost. Project home on Devpost. Back to the full gallery on Devpost.
This competitive analysis was produced by top-founders.com (opens in a new tab)
Generated by a language model from this project's public Devpost page — its tagline, the author's own write-up and any built-with tags listed there — as captured in August 2026. Short quotations are the author's words. It is an opinion on the idea as a business, not on the people behind it, and it reflects the description as published then. If the project has moved on, request a correction below. The analysis is not independent research and contains no verified traction, revenue or customer data.
An independent guide by KFG International LLC — not affiliated with, endorsed by, or connected to Devpost or OpenAI.