

Archive position — measured, not model output
0 likes on Devpost
2,263 of the 7,850 archived projects have more likes, and 5,587 share exactly 0 — so this project's #7,003 place in the like-ranked listing is a tie-break inside that group, not a ranking.
Projects (log scale)
Likes on Devpost. ▲ marks this project's group.
Show the figures
| Likes | Projects | Share of archive |
|---|---|---|
| 0 | 5,587 | 71.2% |
| 1 | 1,758 | 22.4% |
| 2 | 284 | 3.6% |
| 3–4 | 132 | 1.7% |
| 5–9 | 75 | 1.0% |
| 10+ | 14 | 0.2% |
 User Stories BotA demo video on every pull request
Get a demo video on every new feature
GitHub App that watches your pull requests and records a narrated, captioned demo.
Save time on demo prep and make informed decisions faster with a video walkthrough of every new feature.
Executive Summary
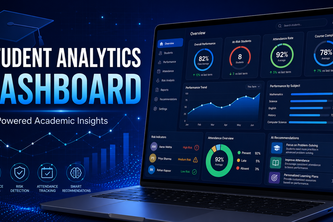
The description states that "student-analytics-dashboard" is a browser-based tool for educational institutions to analyze student performance using uploaded datasets. The author describes it as an application that allows users to upload their own student dataset, map its columns, and generate interactive analytics dashboards with risk identification and recommendations. It was built as a hackathon submission and deployed via GitHub Pages.
The project appears to be a proof-of-concept prototype for academic data visualization and early-risk detection. The author claims it supports custom datasets, automated analytics, and exportable reports, but no evidence of revenue, customers or adoption is provided.
Most important open question
Is there any evidence that this tool has been used in real educational settings, or that the author's claims about its functionality are accurate beyond the hackathon prototype?
What The Product Actually Is
The description states that the "student-analytics-dashboard" is an application that allows users to upload student datasets and generate interactive analytics dashboards. It includes features such as:
- Custom data upload and column mapping
- Academic performance and attendance analytics
- Automated student risk identification
- Interactive charts and comparative analysis
- Data-driven recommendations and interventions
- Exportable PDF reports
- Responsive interface
The application is built with React, TypeScript, Vite, Tailwind CSS, Recharts, Zustand, SheetJS, jsPDF, and brain.js for machine learning components. It is deployed through GitHub Pages with automated builds via GitHub Actions.
Evidence The author's own write-up describes the tool's functionality and technical stack.
Positioning & Claim Evolution
The description states that the application was created to help educators identify academic risks early, understand performance patterns, and make informed decisions through one accessible dashboard. It aims to transform raw academic data into clear insights, addressing the challenge of manual review of marks, attendance and performance records.
The author claims it works with user-provided datasets instead of hardcoded ones, combining data preparation, visualization, risk detection, recommendations and reporting within one browser-based platform. The tool is described as fully automated and free to use without requiring software installation.
Evidence The author's own write-up describes the positioning and evolution of the product from a hackathon idea into a potential academic intelligence platform.
Target Customer & ICP
The description states that the target users are educational institutions, particularly teachers who need to manually review student data. The tool is positioned to help educators identify students requiring support by analyzing academic performance and attendance records.
Evidence The author's own write-up describes the intended user base as educators and institutions dealing with student data analysis challenges.
Business Model & Pricing Evidence
Not evidenced. The description does not contain any information about pricing, monetization or business model.
Technical & Delivery Signals
The description states that the application was built using React, TypeScript, Vite, Tailwind CSS, Recharts, Zustand, SheetJS, jsPDF, and brain.js for machine learning components. It is deployed through GitHub Pages with automated builds via GitHub Actions.
The author mentions challenges related to data cleaning, risk-score consistency, browser-based machine-learning dependencies, and static hosting, which were solved through optimization of the build process, routing adaptation for GitHub Pages, and creation of an automated deployment workflow.
Evidence The author's own write-up describes the technical stack and delivery approach.
Traction & Maturity Signals
Not evidenced. There is no evidence provided about usage, adoption, customers, revenue or any traction metrics beyond the fact that it was submitted to a hackathon.
Competitive Context
Not evidenced. No information is provided about competitors or market positioning beyond the author's own claims.
Open Questions & Risks
- The tool appears to be a hackathon prototype with no evidence of real-world usage
- The description states it works with user-provided datasets but does not specify how it handles data privacy or security concerns
- No evidence of any revenue, customers or adoption beyond the author's own claims
- The project is deployed on GitHub Pages, suggesting it may be a demo rather than a production-ready solution
- The use of browser-based machine learning (brain.js) may limit scalability and performance for large datasets
Inference Given that this was submitted to a hackathon and deployed via GitHub Pages, there's no indication it has moved beyond prototype stage or gained any traction.
Questions the description leaves open
- What specific educational institutions have used this tool in practice?
- How does the tool handle data privacy and security for student information?
- Has the tool been tested with real datasets from actual schools or universities?
- What is the current status of the project beyond the hackathon submission?
- Are there any plans to monetize the product, and if so, what model are you considering?
- How do you plan to address scalability issues for larger educational institutions?
- What validation have you received from educators about the accuracy of risk identification?
Overall Assessment
Not evidenced. There is no information provided about funding rounds, valuations, or any investment or partnership activity beyond the hackathon submission.
Inference Based on the self-reported description alone, this appears to be a prototype that has not yet demonstrated commercial viability or traction. The lack of evidence for revenue, customers or adoption makes it difficult to assess its potential as an investment or partnership opportunity.
User Stories BotA demo video on every pull request
Get a demo video on every new feature
GitHub App that watches your pull requests and records a narrated, captioned demo.
Save time on demo prep and make informed decisions faster with a video walkthrough of every new feature.
Source
Submitted to the OpenAI 2026 hackathon on Devpost. Project home on Devpost. Back to the full gallery on Devpost.
This competitive analysis was produced by top-founders.com (opens in a new tab)
Generated by a language model from this project's public Devpost page — its tagline, the author's own write-up and any built-with tags listed there — as captured in August 2026. Short quotations are the author's words. It is an opinion on the idea as a business, not on the people behind it, and it reflects the description as published then. If the project has moved on, request a correction below. The analysis is not independent research and contains no verified traction, revenue or customer data.
An independent guide by KFG International LLC — not affiliated with, endorsed by, or connected to Devpost or OpenAI.