

Archive position — measured, not model output
3 likes on Devpost
128 of the 7,850 archived projects have more likes, and 93 share exactly 3 — so this project's #179 place in the like-ranked listing is a tie-break inside that group, not a ranking.
Projects (log scale)
Likes on Devpost. ▲ marks this project's group.
Show the figures
| Likes | Projects | Share of archive |
|---|---|---|
| 0 | 5,587 | 71.2% |
| 1 | 1,758 | 22.4% |
| 2 | 284 | 3.6% |
| 3–4 | 132 | 1.7% |
| 5–9 | 75 | 1.0% |
| 10+ | 14 | 0.2% |
 User Stories BotA demo video on every pull request
Get a demo video on every new feature
GitHub App that watches your pull requests and records a narrated, captioned demo.
Save time on demo prep and make informed decisions faster with a video walkthrough of every new feature.
Executive Summary
Company: newengrid
Self-reported basis: The description is entirely self-reported by the project author and unverified.
Commercial due-diligence read: This appears to be a pre-MVP, internal tool for distribution network planning in electric utilities. It is built as a local web application with map-based visualization of grid data, projects, and forecasting. The platform is described as a "Palantir-style" platform for grid planning but tailored to the pre-engineering stage. It has no evidence of revenue, customers or traction beyond an internal MVP. The most important open question is whether this tool can scale beyond its current local use case and be adopted by multiple teams or utilities.
What The Product Actually Is
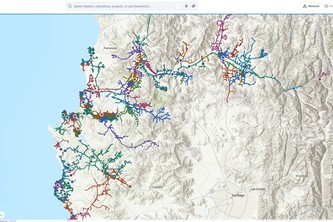
The description states that newengrid is a local, company-wide web application for distribution network planning in electric utilities. It displays the medium-voltage electrical network including major grid devices such as fuses, reclosers, capacitor banks, step-voltage regulators, and autotransformers on an interactive map.
The platform supports three core functions:
- Grid context: showing feeders with summary information like installed capacity, number of customers, devices, loading indicators, reliability indices, and related projects
- Grid projects: displaying where investment projects are located, their scope, affected feeders, and progress (reinforcements, extensions, equipment, topology changes, switching operations)
- Grid forecasting: showing projected loading data through a time slider associated with network elements
The platform is built using Python (FastAPI, DuckDB, Pandas, PyArrow) for backend and React/TypeScript/Vite/ArcGIS Maps SDK for frontend.
Positioning & Claim Evolution
The description states that newengrid was envisioned as a "Palantir-style platform" but built specifically for distribution network planning. It aims to provide a shared view of the grid, align teams on investment needs, and replace legacy formats like PDFs, Excel files, and PowerPoint presentations.
The author describes it as similar to "pushing a branch in software development" — where changes are reflected immediately in one shared platform rather than redistributed through multiple file versions. The positioning is that it helps planners, operations, and project teams share one clear view of the grid and understand why and where investments are needed.
Target Customer & ICP
The description states that newengrid was built for planning, operations, engineering, and construction teams within electric utility companies. It is specifically described as being built for "distribution network planning" and targeting users who work at the pre-engineering stage of projects.
The author identifies themselves as having been a Head of Planning at one of Chile's major electric utility companies, suggesting the target customer is internal staff in large utilities with distribution network planning responsibilities.
Business Model & Pricing Evidence
Not evidenced. The description does not contain any information about pricing models, revenue streams, or business model details.
Technical & Delivery Signals
The platform was built using:
- Backend: Python (FastAPI, DuckDB, Pandas, PyArrow)
- Frontend: React, TypeScript, Vite, ArcGIS Maps SDK, Zustand, TanStack Query
- Data handling approach: spatial service that streams only visible network features in map viewport
- Architecture decision: avoid loading entire network into browser; use precomputed spatial envelopes and level-of-detail rules
The platform supports:
- Map navigation with zoom and pan functionality
- Project creation and editing capabilities (described as next step)
- Natural-language command layer (Copilot feature)
- Integration with PowerFactory (planned)
Traction & Maturity Signals
Not evidenced. The description does not contain any information about revenue, customers, usage metrics, or adoption beyond the internal MVP.
The description states that:
- It was built during Build Week
- A small group of users can interact with it simultaneously
- It is already fast and usable on a local network
- It has been deployed in an internal environment
Competitive Context
Not evidenced. The description does not contain any information about competitors, market positioning, or competitive landscape.
Open Questions & Risks
Risk 1: No evidence of traction or customer adoption beyond internal MVP
Risk 2: Platform is described as local-only and currently only usable on a local network
Risk 3: The project module was described as the most complex part and still under development, suggesting incomplete functionality
Risk 4: Data ingestion pipelines are described as not yet formalized or sustainable for production use
Risk 5: No evidence of scalability beyond current single utility use case
Risk 6: The platform is described as being built for a specific industry (electric utilities) with no indication of broader market applicability
Questions the description leaves open
- What is the current scope and size of the internal user base?
- How is data currently ingested into the system, and what are the plans for formalizing this process?
- What are the specific technical limitations preventing wider deployment beyond local network use?
- How does the platform handle concurrent users beyond the small group currently using it?
- What are the exact requirements for integrating with PowerFactory, and how much development time is estimated?
- Are there any plans to make this available externally or to other utilities?
- What is the timeline for making project creation/editing capabilities fully functional?
- How does the platform handle data versioning and consistency across different types of grid information (network changes, projects, loading projections)?
- What are the specific challenges in representing topology changes that were mentioned as particularly difficult?
- How do you plan to transition from the current MVP to a production-ready system with formal data governance?
Overall Assessment
Not evidenced. The description does not contain any information about funding rounds, valuations, or investment status.
The platform appears to be in early development stage (MVP built during Build Week) and is described as an internal tool for one utility company's planning needs. It has no evidence of commercial traction, revenue, or customer adoption beyond the initial development phase. The most important open question remains whether this can scale beyond its current local use case and be adopted by multiple teams or utilities.
User Stories BotA demo video on every pull request
Get a demo video on every new feature
GitHub App that watches your pull requests and records a narrated, captioned demo.
Save time on demo prep and make informed decisions faster with a video walkthrough of every new feature.
Source
Submitted to the OpenAI 2026 hackathon on Devpost. Project home on Devpost. Back to the full gallery on Devpost.
This competitive analysis was produced by top-founders.com (opens in a new tab)
Generated by a language model from this project's public Devpost page — its tagline, the author's own write-up and any built-with tags listed there — as captured in August 2026. Short quotations are the author's words. It is an opinion on the idea as a business, not on the people behind it, and it reflects the description as published then. If the project has moved on, request a correction below. The analysis is not independent research and contains no verified traction, revenue or customer data.
An independent guide by KFG International LLC — not affiliated with, endorsed by, or connected to Devpost or OpenAI.