

Archive position — measured, not model output
0 likes on Devpost
2,263 of the 7,850 archived projects have more likes, and 5,587 share exactly 0 — so this project's #4,867 place in the like-ranked listing is a tie-break inside that group, not a ranking.
Projects (log scale)
Likes on Devpost. ▲ marks this project's group.
Show the figures
| Likes | Projects | Share of archive |
|---|---|---|
| 0 | 5,587 | 71.2% |
| 1 | 1,758 | 22.4% |
| 2 | 284 | 3.6% |
| 3–4 | 132 | 1.7% |
| 5–9 | 75 | 1.0% |
| 10+ | 14 | 0.2% |
 User Stories BotA demo video on every pull request
Get a demo video on every new feature
GitHub App that watches your pull requests and records a narrated, captioned demo.
Save time on demo prep and make informed decisions faster with a video walkthrough of every new feature.
Executive Summary
What the company appears to be
LagLens is a developer tool for monitoring real user click-to-response latency in web applications, with an aim to automatically trace performance regressions back to specific dependency changes or deployments. It is presented as a self-contained SDK and dashboard solution that integrates into React, Next.js, Vue, Angular, and vanilla JavaScript apps.
What changed
The project was submitted to the OpenAI 2026 hackathon on Devpost, indicating it is an early-stage MVP with limited functionality. It is described as a single-person effort built using Next.js, Node.js, Prisma, SQLite, and TypeScript.
Single most important open question
Is there any evidence of real-world usage or traction beyond the author’s own demo setup?
What The Product Actually Is
The description states that LagLens is a performance monitoring tool for web applications. It consists of:
- A client-side SDK that observes user interactions (clicks, DOM updates, network requests) and measures actual latency.
- A correlation engine that links detected slow interactions with deployment history, dependency changes, and bundle size variations.
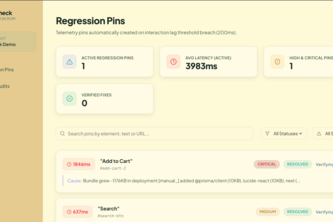
- A dashboard that displays slow interaction pins, audit history, and root-cause explanations.
It is built using:
- Frontend: CSS, HTML, Next.js, React, Vue, Angular, Vanilla JS
- Backend: Node.js, Prisma, SQLite
- Language: TypeScript
The SDK can be integrated via script tag or NPM installation. The tool supports real user monitoring (RUM) and aims to automate root-cause analysis of performance issues.
Confidence Low — all details are self-reported by the author.
Positioning & Claim Evolution
The description states that LagLens is positioned as a solution for developers who want to avoid spending hours debugging why a website became slow. It claims to eliminate guesswork and dashboards, instead providing direct answers through automated tracing of performance issues back to specific dependencies or deployments.
It also describes itself as:
- Lightweight
- Easy to integrate
- Focused on real user data rather than synthetic benchmarks
Inference The positioning suggests a move away from traditional performance monitoring tools that require manual investigation or dashboard navigation. However, the absence of any customer feedback, usage metrics, or third-party validation makes this claim unproven.
Target Customer & ICP
The description indicates LagLens targets developers working on web applications, particularly those using:
- React
- Next.js
- Vue
- Angular
- Vanilla JavaScript
It is designed for teams that need to debug performance regressions quickly and efficiently, especially in environments where deployment changes may cause slowdowns.
Confidence Low — no evidence of actual customers or target segments beyond the author’s own use case.
Business Model & Pricing Evidence
There is no mention of pricing, licensing, or monetization strategy in the description. The tool is presented as an open-source or internal MVP with no indication of a commercial offering.
Confidence Not evidenced — no data on how it would be sold or priced.
Technical & Delivery Signals
The project uses:
- Frontend frameworks: React, Next.js, Vue, Angular, Vanilla JS
- Backend stack: Node.js, Prisma, SQLite
- Language: TypeScript
- Integration methods: Script tag and NPM package
- Deployment support: Single-project MVP with no multi-tenant or production alerting features
It includes:
- Lightweight SDK
- Dashboard UI
- Deployment audit history
- Bundle size tracking
- Dependency change detection
Limitations mentioned
- Single-project support
- SQLite database
- No authentication system
- No production alerting
- No session replay functionality
Future roadmap includes
- GitHub Actions deployment auditing
- Multi-project support
- Real-time alerting and notifications
- Session replay
- Advanced analytics
Confidence Medium — some technical details are provided, but no evidence of scalability or enterprise-grade delivery.
Traction & Maturity Signals
The project is described as an MVP, submitted to a hackathon (OpenAI 2026), and built by one person. No revenue, customers, or adoption data are mentioned.
Confidence Very low — no traction evidence beyond the author’s own demo setup.
Competitive Context
No competitive landscape is described in the project write-up. The author does not reference existing tools such as:
- Lighthouse
- Web Vitals
- New Relic
- Sentry
- LogRocket
- SpeedCurve
Confidence Not evidenced — no comparison or differentiation from other tools.
Open Questions & Risks
- Single-person development: The entire project is attributed to one individual, raising questions about scalability and long-term maintenance.
- No production alerting or authentication: These are basic features expected in performance monitoring tools.
- MVP status: The tool is described as an MVP with many planned features not yet implemented.
- No revenue or customer data: No evidence of real-world usage, adoption, or monetization.
- Limited platform support: Only supports certain frontend frameworks and browsers.
- No third-party validation: All claims are self-reported; no independent verification.
Confidence High — these risks are clearly stated in the description.
Questions the description leaves open
- What is the actual user base or internal usage of this tool?
- Are there any existing customers or pilot programs?
- How does LagLens compare to existing tools like Sentry, LogRocket, or Lighthouse?
- What are the key assumptions behind its automated root-cause tracing?
- Can you demonstrate how it handles complex deployment scenarios or multi-team environments?
- What is the plan for authentication, alerting, and scalability beyond the MVP?
- How does it handle edge cases in performance data collection (e.g., mobile users, low bandwidth)?
- Is there any intention to open-source parts of the tool?
Overall Assessment
Not evidenced — no financials, traction, or commercial viability data are provided.
However, based on the self-reported description:
- LagLens appears to be a proof-of-concept or early-stage MVP.
- It has some technical clarity and a defined problem space.
- The author’s vision aligns with current trends in performance monitoring.
- But there is no evidence of product-market fit, revenue, or customer traction.
Inference If this tool were to mature into a commercial offering, it could address a real need for automated performance debugging. However, as-is, it is not ready for investment or partnership consideration without further validation and demonstration of usage.
User Stories BotA demo video on every pull request
Get a demo video on every new feature
GitHub App that watches your pull requests and records a narrated, captioned demo.
Save time on demo prep and make informed decisions faster with a video walkthrough of every new feature.
Source
Submitted to the OpenAI 2026 hackathon on Devpost. Project home on Devpost. Back to the full gallery on Devpost.
This competitive analysis was produced by top-founders.com (opens in a new tab)
Generated by a language model from this project's public Devpost page — its tagline, the author's own write-up and any built-with tags listed there — as captured in August 2026. Short quotations are the author's words. It is an opinion on the idea as a business, not on the people behind it, and it reflects the description as published then. If the project has moved on, request a correction below. The analysis is not independent research and contains no verified traction, revenue or customer data.
An independent guide by KFG International LLC — not affiliated with, endorsed by, or connected to Devpost or OpenAI.