

Archive position — measured, not model output
1 like on Devpost
505 of the 7,850 archived projects have more likes, and 1,758 share exactly 1 — so this project's #779 place in the like-ranked listing is a tie-break inside that group, not a ranking.
Projects (log scale)
Likes on Devpost. ▲ marks this project's group.
Show the figures
| Likes | Projects | Share of archive |
|---|---|---|
| 0 | 5,587 | 71.2% |
| 1 | 1,758 | 22.4% |
| 2 | 284 | 3.6% |
| 3–4 | 132 | 1.7% |
| 5–9 | 75 | 1.0% |
| 10+ | 14 | 0.2% |
 User Stories BotA demo video on every pull request
Get a demo video on every new feature
GitHub App that watches your pull requests and records a narrated, captioned demo.
Save time on demo prep and make informed decisions faster with a video walkthrough of every new feature.
Executive Summary
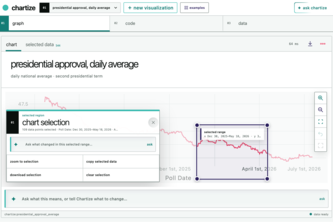
Chartize is a self-reported local-first visualization studio built with AI assistance, using GGSQL and GPT-5.6-Luna to generate charts and maps from data in conversation with an AI agent. The system is described as being developed entirely within a single AI coding session using Codex, leveraging technologies like Next.js, React, Monaco editor, Vega-lite, and GGSQL-wasm.
The author states that the project was submitted to the OpenAI 2026 hackathon, but there is no evidence of revenue, customers, or traction beyond its own description. The product appears to be in early development, with no external validation or market adoption reported.
The single most important open question
Is Chartize intended as a developer tool for exploratory data analysis, or as a platform for non-technical users to create visualizations? This distinction will determine whether the project has a viable commercial path and target market.
What The Product Actually Is
The description states that Chartize is a "local-first visualization studio" where users can explore public or private data using GGSQL and GPT-5.6-Luna. It allows for creating graphs and maps through AI interaction, with code, source rows, charts, marks, and AI discussion in one workspace.
It uses:
- GGSQL (a SQL extension that adds Grammar of Graphics)
- GPT-5.6-Luna as the core AI agent
- Vega-lite for rendering visualizations
- Monaco editor
- Next.js + React for frontend and API routes
- Spatialite and GeoJSON for geospatial data handling
The system is described as being built in a single Codex session, with all code AI-generated.
Inference: The product appears to be an experimental or prototype tool aimed at enabling users to generate visualizations from structured data using AI assistance. It is not yet clear if it targets developers or non-technical users.
Positioning & Claim Evolution
The author claims that Chartize was inspired by Posit’s release of GGSQL and aims to combine data querying and visualization in a single language, similar to how GGSQL extends SQL with Grammar of Graphics.
It positions itself as:
- A local-first system
- An AI-powered visualization studio
- A workspace where code, data, and AI explanations coexist
- Inspired by GNU Emacs’ DWIM interface for intelligent suggestions
Claim vs Fact: The description does not provide evidence of prior user feedback, market demand, or product-market fit. It is a self-reported vision of what the tool could do, not proof of traction.
Target Customer & ICP
The author describes Chartize as useful for:
- Exploring public or private data
- Users who want to generate charts and maps from data
- Those interested in AI-assisted data cleaning and visualization enhancement
There is no explicit mention of a specific persona, segment, or buyer type. The description implies it may be aimed at:
- Data analysts or scientists
- Developers working with data
- Non-technical users who want to visualize data without coding
Not evidenced: No clear ICP (Ideal Customer Profile) is defined. No evidence of customer interviews, personas, or user research.
Business Model & Pricing Evidence
There is no mention of pricing, monetization strategy, or business model in the description.
Not evidenced: No indication of how Chartize intends to make money, whether through subscriptions, usage fees, or other models.
Technical & Delivery Signals
The system is described as:
- Built entirely in a single Codex session
- Using AI-generated code (Codex)
- Local-first architecture with no server-side data processing
- Uses GGSQL-wasm, Spatialite, Vega-lite, and Monaco editor
- Designed to be responsive across devices, including mobile
Inference: The use of AI for development suggests a rapid prototyping approach. However, the lack of external validation or scalability considerations raises questions about long-term viability.
Traction & Maturity Signals
The description states:
- The project was submitted to the OpenAI 2026 hackathon
- It includes examples of visualizations generated via AI (e.g., MTA delays, temperature heatmap, US land usage)
- The author is proud of the local-first data storage system and AI-generated outputs
Not evidenced: No evidence of user adoption, revenue, or product usage beyond the author’s own claims. No mention of any external users, feedback, or market testing.
Competitive Context
The author references:
- Posit’s GGSQL
- The Grammar of Graphics (used in R community)
- AI-assisted data visualization tools
No direct competitors are named, nor is there evidence of existing similar products in the market. The project appears to be a novel concept within the hackathon context.
Inference: If Chartize becomes a viable product, it may compete with tools like Tableau, Power BI, or open-source alternatives that support data visualization and AI integration.
Open Questions & Risks
- No traction or revenue evidence — this is a self-reported prototype
- Unverified claims — the author states that GPT-5.6 models are used but does not confirm their actual performance or availability
- Single-person development — no team, no external validation, no product-market fit testing
- Unclear commercial intent — unclear if this is a side project or a serious business idea
- AI dependency — heavily reliant on AI tools that may not be stable or scalable
Inference: The lack of any real-world usage or feedback makes it difficult to assess whether Chartize has a sustainable path to market.
Questions the description leaves open
- What is the intended user base for Chartize? Is it aimed at developers, analysts, or general users?
- How does the local-first architecture affect scalability and sharing of visualizations?
- Are there any plans to integrate with external APIs or datasets beyond preloaded files?
- What are the long-term goals for monetization or product development?
- Can you demonstrate actual use cases beyond the examples provided in the write-up?
- How does Chartize plan to handle data privacy and security, especially with local storage?
Overall Assessment
Not evidenced: There is no evidence of revenue, customers, or traction to support an investment or partnership decision.
The project appears to be a self-reported prototype, likely built during a hackathon. It lacks any external validation, real-world usage, or clear commercial strategy.
Confidence Level: Low
This analysis is based entirely on the author’s own description and self-reporting. No third-party data, revenue figures, or customer feedback are available to assess viability or traction.
User Stories BotA demo video on every pull request
Get a demo video on every new feature
GitHub App that watches your pull requests and records a narrated, captioned demo.
Save time on demo prep and make informed decisions faster with a video walkthrough of every new feature.
Source
Submitted to the OpenAI 2026 hackathon on Devpost. Project home on Devpost. Back to the full gallery on Devpost.
This competitive analysis was produced by top-founders.com (opens in a new tab)
Generated by a language model from this project's public Devpost page — its tagline, the author's own write-up and any built-with tags listed there — as captured in August 2026. Short quotations are the author's words. It is an opinion on the idea as a business, not on the people behind it, and it reflects the description as published then. If the project has moved on, request a correction below. The analysis is not independent research and contains no verified traction, revenue or customer data.
An independent guide by KFG International LLC — not affiliated with, endorsed by, or connected to Devpost or OpenAI.