

Archive position — measured, not model output
1 like on Devpost
505 of the 7,850 archived projects have more likes, and 1,758 share exactly 1 — so this project's #778 place in the like-ranked listing is a tie-break inside that group, not a ranking.
Projects (log scale)
Likes on Devpost. ▲ marks this project's group.
Show the figures
| Likes | Projects | Share of archive |
|---|---|---|
| 0 | 5,587 | 71.2% |
| 1 | 1,758 | 22.4% |
| 2 | 284 | 3.6% |
| 3–4 | 132 | 1.7% |
| 5–9 | 75 | 1.0% |
| 10+ | 14 | 0.2% |
 User Stories BotA demo video on every pull request
Get a demo video on every new feature
GitHub App that watches your pull requests and records a narrated, captioned demo.
Save time on demo prep and make informed decisions faster with a video walkthrough of every new feature.
Executive Summary
What the company appears to be
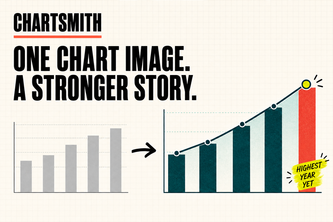
Chart Smith is a self-reported AI-powered tool that transforms chart images into stronger visualizations using GPT-5.6 and other technologies. The author describes it as a one-shot, image-only system that reconstructs the underlying message, explores design alternatives, and delivers a final rendered chart after quality checks.
What changed
During Build Week, the author restructured an earlier experimental version into a coherent product with a defined input contract (one chart image), a shorter workflow focused on persuasion, mandatory inspection and repair steps, and a web-facing interface. The system now supports ten example journeys and local uploads with reconnect-safe long-running jobs.
Single most important open question
Does Chart Smith actually deliver better visualizations than a single prompt to a general-purpose model? The author claims that its multi-step process finds issues missed by simpler approaches, but this is not independently verified.
Analysis basis
This report is based entirely on the self-reported project description provided by the author. No external verification or historical data is available. All statements reflect the author's own account and should be treated as claims, not facts.
What The Product Actually Is
The description states that Chart Smith:
- Turns chart images into stronger visualizations
- Uses GPT-5.6 for perceptual reconstruction, message identification, concept proposal, translation to render direction, inspection, repair recommendation, and final judgment
- Employs a deterministic Python orchestrator with bounded visual reasoning
- Has a one-shot workflow: upload image → reconstruct → explore 3 directions → select and render one → inspect rendered image → repair if needed → release only after quality gates
- Is built using React, TypeScript, Next.js, Python service, and various AI tools including Codex, GPT-5.6, and image models
Inference The product appears to be a web-based tool that accepts chart images and outputs improved versions through an automated process involving AI reasoning and human review stages.
Positioning & Claim Evolution
The author states:
- Chart Smith aims to "turn any chart into strong visualization"
- It is not just restyling but involves reorganizing composition, adding annotations, or introducing visual devices difficult with conventional libraries
- The system works without raw data, context, or guidance—only a chart image
- It is designed to reverse-engineer the underlying message and improve presentation effectiveness
Inference Chart Smith positions itself as an AI-driven visualization enhancement tool that operates autonomously from a single input image. Its evolution from experimental to structured product suggests a shift toward usability and clarity in execution.
Target Customer & ICP
The description states:
- The author's boss reads only one chart from emails, so the system was designed to capture attention and deliver full messages
- It is intended for users who want to improve existing charts without needing to understand design principles or data structures
- Users do not interpret the chart for the system; it handles all decisions autonomously
Inference The target customer likely includes professionals who receive or create charts but lack time or expertise to optimize them visually. However, no explicit ICP is defined beyond this general use case.
Business Model & Pricing Evidence
Not evidenced.
Finding
There is no mention of pricing, monetization strategy, or business model in the description.
Technical & Delivery Signals
The description states:
- Built with React, TypeScript, Next.js, Python service
- Uses GPT-5.6 for visual reasoning across multiple stages
- Employs Codex to structure and clean repository
- Supports image-only uploads and reconnect-safe long-running jobs
- Includes a judge-facing web product showing intermediate results
- Has ten example journeys loaded immediately
- Retains provenance and release evidence for every run
Inference The technical stack suggests a modern SaaS-like architecture with AI integration. The delivery approach includes both showcase examples and local upload capabilities, indicating potential scalability considerations.
Traction & Maturity Signals
Not evidenced.
Finding
No revenue, customer base, usage metrics, or adoption data are provided beyond the author's own account of development efforts.
Competitive Context
Not evidenced.
Finding
There is no reference to competitors, market positioning, or competitive landscape in the description.
Open Questions & Risks
- The system claims to work without raw data or context, yet the author notes that semantic errors are not acceptable
- The author admits they are not a design expert and may introduce bias into feedback
- The product is described as experimental with no external validation of results
- No evidence of real-world testing or user feedback beyond the developer's own experience
Inference The lack of independent verification, customer data, or performance benchmarks raises questions about whether the system delivers on its promises in practice.
Questions the description leaves open
- What specific improvements does Chart Smith make compared to a single prompt to a general-purpose model?
- How does the system handle ambiguous or low-quality input images?
- Are there any known limitations or edge cases where the system fails?
- Has the system been tested with actual users outside of the developer's own judgment?
- What kind of data or feedback is used to train or refine the AI components?
Overall Assessment
Not evidenced.
Finding
No information is provided about funding status, valuation, or investment interest. The project appears to be a hackathon submission with no indication of commercial traction or strategic partnerships.
User Stories BotA demo video on every pull request
Get a demo video on every new feature
GitHub App that watches your pull requests and records a narrated, captioned demo.
Save time on demo prep and make informed decisions faster with a video walkthrough of every new feature.
Source
Submitted to the OpenAI 2026 hackathon on Devpost. Project home on Devpost. Back to the full gallery on Devpost.
This competitive analysis was produced by top-founders.com (opens in a new tab)
Generated by a language model from this project's public Devpost page — its tagline, the author's own write-up and any built-with tags listed there — as captured in August 2026. Short quotations are the author's words. It is an opinion on the idea as a business, not on the people behind it, and it reflects the description as published then. If the project has moved on, request a correction below. The analysis is not independent research and contains no verified traction, revenue or customer data.
An independent guide by KFG International LLC — not affiliated with, endorsed by, or connected to Devpost or OpenAI.