

Archive position — measured, not model output
0 likes on Devpost
2,263 of the 7,850 archived projects have more likes, and 5,587 share exactly 0 — so this project's #7,582 place in the like-ranked listing is a tie-break inside that group, not a ranking.
Projects (log scale)
Likes on Devpost. ▲ marks this project's group.
Show the figures
| Likes | Projects | Share of archive |
|---|---|---|
| 0 | 5,587 | 71.2% |
| 1 | 1,758 | 22.4% |
| 2 | 284 | 3.6% |
| 3–4 | 132 | 1.7% |
| 5–9 | 75 | 1.0% |
| 10+ | 14 | 0.2% |
 User Stories BotA demo video on every pull request
Get a demo video on every new feature
GitHub App that watches your pull requests and records a narrated, captioned demo.
Save time on demo prep and make informed decisions faster with a video walkthrough of every new feature.
Executive Summary
What the company appears to be
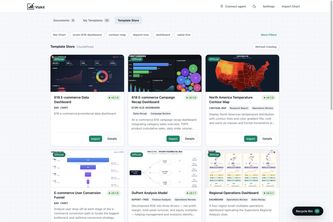
Vizkit is an AI-native data visualization platform described by its author as a tool for creating, refining, and applying professional chart templates using natural language. It aims to bridge the gap between rigid charting tools and code-heavy libraries by offering an editable, reusable output that combines data structure, visual design, business context, and analytical insight.
What changed
The project is presented as a self-contained, AI-powered visualization workspace built with React, TypeScript, D3.js, and Electron. It supports both local and web deployment, uses SQLite for local storage, and integrates AI agents through an HTTP API and Skill interface. The author describes it as a personal project by one individual (junfeng lu), submitted to the OpenAI 2026 hackathon.
Single most important open question
Is there evidence of traction or commercial adoption beyond this self-reported description? There is no indication of revenue, customers, or usage metrics. The platform’s business model and pricing are not described, nor is there any mention of monetization strategy or market fit beyond the author's own claims.
What The Product Actually Is
The description states that Vizkit is an AI-powered workspace for creating, refining, and applying professional chart templates. It allows users to describe visualizations in natural language or start from existing templates, generating a complete chart workspace with sample data, configuration logic, rendering code, and business context.
Key features include:
- Natural-language instructions for chart refinement (e.g., “use a technology-blue palette”)
- Support for tabular data import (CSV, Excel)
- Generation of advanced visualizations (Sankey diagrams, gauges, heatmaps, custom D3 graphics)
- Export in multiple formats (PNG, SVG, PDF, HTML)
- Integration with external AI agents via HTTP API and Skill interface
- File-based workspace contract that defines chart behavior and structure
The system is built using technologies such as React, TypeScript, Express, D3.js, Puppeteer, SQLite, and Electron. It supports both desktop and web deployment.
Evidence
- The author states Vizkit generates a complete chart workspace with sample data, configuration logic, rendering code, and business context.
- It supports natural-language instructions for refinement.
- It allows importing tabular data and generating various chart types.
- It exports charts in multiple formats.
- It integrates with external AI agents through documented APIs.
Inference The system is designed to produce reusable chart templates rather than one-off images, based on the claim that it supports versioning, editing, and reuse of visualizations.
Positioning & Claim Evolution
Vizkit positions itself as an alternative to rigid chart tools (e.g., Excel) and code-heavy libraries (e.g., D3), offering a middle ground where AI can generate polished, editable charts without sacrificing control or reusability.
The author frames the platform around the idea that “a chart should not be a disposable visual,” but instead a reusable business communication asset. This positioning emphasizes:
- Reusability of charts across datasets
- Editability through both UI and AI
- Structured workflow for AI-generated outputs
- Compatibility with both human users and AI agents
It also positions itself as a tool that can support AI agents in creating visualizations, suggesting it may be part of a broader ecosystem or execution layer for AI-driven data communication.
Evidence
- The author states Vizkit is built around the idea of a chart being a reusable business communication asset.
- It supports both human and AI interaction through UI and API.
- It uses a file-based workspace contract to standardize chart behavior.
Inference The platform’s positioning implies it may evolve into a collaborative or enterprise-grade tool for visual communication, especially with mentions of dashboards, team libraries, and brand systems.
Target Customer & ICP
The description does not clearly define target customers or ideal customer profiles (ICP). However, the author suggests Vizkit is useful for teams that need to create, manage, and share insights faster. It also targets users who want to avoid either overly rigid templates or complex coding workflows.
It appears aimed at:
- Data analysts or business intelligence professionals
- Teams working with data visualization in reporting or presentations
- Users who value reusable chart assets over one-off outputs
- AI agents or developers looking for a structured environment to generate visualizations
There is no evidence of specific personas, segments, or use cases beyond the general description.
Evidence
- The tagline says it helps teams create, manage, and share insights faster.
- It supports both human users and AI agents.
- It allows for reusable chart templates.
Inference The platform may appeal to small teams or individuals who want more flexibility than Excel but don’t need full engineering support. It could also be attractive to enterprises seeking a standardized way to generate visualizations from AI.
Business Model & Pricing Evidence
There is no evidence of a business model or pricing strategy in the description. The author does not mention monetization, subscriptions, licensing, or any commercial framework.
Evidence
- No mention of revenue streams, pricing tiers, or customer acquisition costs.
- No indication of whether Vizkit is open-source, freemium, or paid.
Inference Given that this is a hackathon submission and the team size is one person, it’s possible that no commercial model has been developed yet. However, the platform could potentially be monetized through enterprise licensing, API access, or SaaS offerings if expanded.
Technical & Delivery Signals
Vizkit is built with modern web technologies including React, TypeScript, Express, D3.js, Puppeteer, and Electron. It supports both desktop and web deployment and uses SQLite for local workspace indexing.
Key technical elements:
- File-based workspace contract that defines chart behavior
- AI runtime with tool-driven workflow and validation checks
- Support for live data sources, scheduling, and dashboard sharing
- Export capabilities in multiple formats (PNG, SVG, PDF, HTML)
- API and Skill interfaces for external agent integration
The system separates the stable workspace protocol from flexible renderer implementations to ensure reliability.
Evidence
- Built with React, TypeScript, Express, D3.js, Puppeteer, Electron, SQLite.
- Supports desktop and web deployment.
- Uses a file-based workspace contract.
- Integrates with AI agents via HTTP API and Skill interface.
- Has validation and render-ready protocols for consistency.
Inference The architecture suggests scalability potential, especially if the platform evolves to support cloud synchronization, multi-user collaboration, or enterprise-grade dashboards.
Traction & Maturity Signals
There is no evidence of traction or maturity beyond the author’s own description. No customer data, usage metrics, revenue figures, or adoption indicators are provided.
Evidence
- The project was submitted to a hackathon.
- Team size is listed as one person (junfeng lu).
- No mention of users, customers, or product adoption.
Inference This is likely an early-stage prototype or proof-of-concept. It may not yet have reached a stable or scalable form suitable for commercial use.
Competitive Context
The description does not provide information about competitors or competitive positioning. The author does not reference existing tools like Tableau, Power BI, Chart.js, or other visualization platforms.
Evidence
- No mention of competitors.
- No comparison to existing tools or market positioning.
Inference Vizkit appears to aim at filling a gap between traditional charting tools and code-heavy libraries. It may compete with AI-powered visualization tools or low-code charting platforms, though no such tools are named.
Open Questions & Risks
- Lack of traction or commercial viability: The project is described as a hackathon submission by one person; there is no evidence of revenue, customers, or product-market fit.
- Unclear monetization strategy: No business model or pricing information is provided.
- Limited team size: With only one developer, scalability and long-term maintenance are concerns.
- Unproven AI integration: While the system supports AI agents, there is no evidence of successful AI-generated outputs or performance metrics.
- No user feedback or real-world testing: The description lacks any indication of how users interact with the product beyond self-reported claims.
Evidence
- Submitted to a hackathon.
- One-person team.
- No revenue, customers, or usage data.
- No mention of testing or validation in real-world settings.
Questions the description leaves open
- What is your plan for monetization and customer acquisition?
- How do you intend to scale beyond a single developer?
- Have you tested the AI integration with real users or external agents?
- What are the key assumptions behind the file-based workspace contract, and how does it handle edge cases?
- Are there any known limitations in rendering consistency across environments (e.g., preview vs export)?
- How do you plan to support collaboration features and multi-user dashboards?
- What is your timeline for moving from prototype to a production-ready product?
Overall Assessment
This is an early-stage, self-reported project submitted as part of a hackathon. There is no evidence of traction, revenue, or commercial adoption. The platform appears to be a proof-of-concept with strong technical foundations and clear intent to build a reusable AI-powered visualization tool.
Confidence level Low
Reasoning
The description is entirely self-reported and lacks any independent verification or data on performance, users, or market fit. It does not indicate whether the product has moved beyond prototype stage or whether there are plans for commercialization.
Assessment Not ready for investment or partnership without further evidence of traction, user feedback, or business model development.
User Stories BotA demo video on every pull request
Get a demo video on every new feature
GitHub App that watches your pull requests and records a narrated, captioned demo.
Save time on demo prep and make informed decisions faster with a video walkthrough of every new feature.
Source
Submitted to the OpenAI 2026 hackathon on Devpost. Project home on Devpost. Back to the full gallery on Devpost.
This competitive analysis was produced by top-founders.com (opens in a new tab)
Generated by a language model from this project's public Devpost page — its tagline, the author's own write-up and any built-with tags listed there — as captured in August 2026. Short quotations are the author's words. It is an opinion on the idea as a business, not on the people behind it, and it reflects the description as published then. If the project has moved on, request a correction below. The analysis is not independent research and contains no verified traction, revenue or customer data.
An independent guide by KFG International LLC — not affiliated with, endorsed by, or connected to Devpost or OpenAI.