

Archive position — measured, not model output
0 likes on Devpost
2,263 of the 7,850 archived projects have more likes, and 5,587 share exactly 0 — so this project's #7,064 place in the like-ranked listing is a tie-break inside that group, not a ranking.
Projects (log scale)
Likes on Devpost. ▲ marks this project's group.
Show the figures
| Likes | Projects | Share of archive |
|---|---|---|
| 0 | 5,587 | 71.2% |
| 1 | 1,758 | 22.4% |
| 2 | 284 | 3.6% |
| 3–4 | 132 | 1.7% |
| 5–9 | 75 | 1.0% |
| 10+ | 14 | 0.2% |
 User Stories BotA demo video on every pull request
Get a demo video on every new feature
GitHub App that watches your pull requests and records a narrated, captioned demo.
Save time on demo prep and make informed decisions faster with a video walkthrough of every new feature.
Executive Summary
What the company appears to be
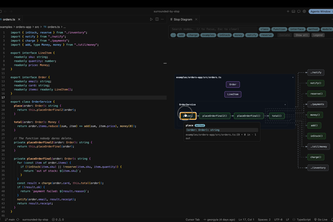
Surrounded By Slop (SBS) is a self-reported VS Code / Cursor extension (with headless CLI) that visualizes codebases as interactive diagrams using deterministic parsers, graph theory and layout engines — not AI. The author states it is built with a strict separation of concerns, local-only operation, and byte-identical reproducibility.
What changed
The project description presents a new approach to understanding code through visualization rather than line-by-line reading. It positions itself as a tool for decoding "slop" — not human communication issues, but the complexity and opacity of modern codebases. The author claims this is an evolution from traditional code review practices, driven by the shift toward AI-assisted development.
Single most important open question
Is there any evidence of actual usage or adoption beyond the author's own development environment? The description states no revenue, customers, or traction data are available.
Note: This analysis is based entirely on self-reported information from the project description. No external verification or historical data exists for this project.
What The Product Actually Is
- The description states that SBS is a VS Code / Cursor extension (plus headless CLI) that turns code into diagrams automatically and deterministically.
- It visualizes structure and call graphs of files, functions, and entire workspaces.
- It supports exporting to draw.io, Mermaid, or SVG formats with byte-for-byte reproducibility.
- The tool uses parsers, graph theory, and layout engines (e.g., tree-sitter, TypeScript compiler API, elkjs), not AI.
- It is described as a pnpm monorepo with distinct packages for core logic, host discovery, extension integration, webview UI, and CLI.
Claim: The product is built on deterministic technology to avoid hallucinations or guesswork.
Evidence: Described as using TypeScript compiler API, tree-sitter, elkjs, and golden-file tests for reproducibility.
Positioning & Claim Evolution
- The author positions SBS as a response to the idea that "you're not surrounded by idiots — you're surrounded by slop" (from Surrounded by Idiots).
- It is framed as a tool to decode code complexity, not just read it.
- The core claim is: “Stop reading code. Look at it.”
- The author emphasizes:
- Determinism over AI
- Local-only operation
- Byte-identical diagrams for Git history
- One IR (intermediate representation) generating multiple outputs
Claim: SBS is a tool to visualize code as a graph, not an AI-generated abstraction.
Evidence: Explicitly states it uses parsers and graph theory instead of AI.
Target Customer & ICP
- The description does not name specific customer segments or personas.
- It implies usage by developers working in TypeScript/JavaScript environments (based on tech stack).
- The tool targets those who find traditional code reading ineffective due to complexity or scale.
- It is described as a VS Code/Cursor extension, suggesting it’s aimed at developers using these editors.
Claim: The target audience includes developers who struggle with large, complex codebases.
Evidence: Framed around the need for visualizing "slop" and understanding structure without reading line-by-line.
Business Model & Pricing Evidence
- No pricing information or business model is stated.
- The tool is described as open-source (no mention of monetization).
- It includes a headless CLI, suggesting potential use in CI/CD pipelines or AI agents — but no commercial intent is expressed.
Claim: There is no evidence of a paid product or revenue model.
Evidence: No pricing, subscriptions, or monetization strategy mentioned.
Technical & Delivery Signals
- Built with TypeScript, Node.js, pnpm, tree-sitter, VS Code extension API, Mermaid, draw.io, elkjs.
- Uses the TypeScript compiler API for call resolution (not regex).
- Implements a pipeline: source → AST → Semantic Graph IR → layout → diagram.
- Supports multiple export formats (SVG, Mermaid, draw.io) with byte-level reproducibility.
- Uses Tarjan’s algorithm to contract strongly connected components in graphs.
- The tool is described as drawing itself — i.e., it visualizes its own architecture.
Claim: The technical stack supports deterministic, local-only visualization.
Evidence: Mentioned use of TypeScript compiler API, golden-file tests, tree-sitter, elkjs, and self-documented architecture.
Traction & Maturity Signals
- No traction data is provided: no customers, users, downloads, or adoption metrics.
- The project is described as a hackathon submission (Devpost entry).
- It is noted to be in early stages ("First Light", "The Map", "X-Ray" milestones).
- The author states it is “gated” and ready for launch but not yet live.
Claim: No evidence of traction or user adoption.
Evidence: No mention of users, downloads, or real-world usage beyond the author’s own development.
Competitive Context
- The description does not name competitors.
- It positions itself as distinct from AI-based tools for code visualization.
- It emphasizes deterministic behavior over guesswork or hallucination.
- It is described as a developer tool focused on local-only operation and reproducibility.
Claim: SBS competes in the space of code visualization, but not with AI-based tools.
Evidence: Explicitly states it avoids AI and focuses on parsers and graph theory.
Open Questions & Risks
- The project is self-reported and unverified; no third-party validation.
- No evidence of real-world usage or customer feedback.
- The tool is described as a single-person effort (team size: 1).
- No pricing, monetization, or go-to-market strategy is evident.
- The author’s own use case is the only one described — no external adoption.
Claim: Lack of traction and commercial viability are key risks.
Evidence: No users, revenue, or market validation; single-person team.
Questions the description leaves open
- What is your definition of “slop” in code, and how does SBS address it?
- How do you plan to scale beyond a single developer’s use case?
- Are there any early adopters or users outside the author’s own environment?
- Is there an intention to monetize this tool? If so, what is your pricing model?
- What are the technical challenges in expanding support for non-TypeScript languages?
- How do you plan to integrate with CI/CD pipelines or AI agents?
Overall Assessment
- The project is described as a hackathon submission and self-developed tool.
- It has no demonstrated traction, revenue, or customer base.
- It is not yet available on public platforms (e.g., VS Code Marketplace).
- It is built with strong technical foundations but lacks commercialization signals.
Assessment: Not evidenced as a viable investment or partnership opportunity.
Confidence: Low — based entirely on self-reported claims and no external validation.
User Stories BotA demo video on every pull request
Get a demo video on every new feature
GitHub App that watches your pull requests and records a narrated, captioned demo.
Save time on demo prep and make informed decisions faster with a video walkthrough of every new feature.
Source
Submitted to the OpenAI 2026 hackathon on Devpost. Project home on Devpost. Back to the full gallery on Devpost.
This competitive analysis was produced by top-founders.com (opens in a new tab)
Generated by a language model from this project's public Devpost page — its tagline, the author's own write-up and any built-with tags listed there — as captured in August 2026. Short quotations are the author's words. It is an opinion on the idea as a business, not on the people behind it, and it reflects the description as published then. If the project has moved on, request a correction below. The analysis is not independent research and contains no verified traction, revenue or customer data.
An independent guide by KFG International LLC — not affiliated with, endorsed by, or connected to Devpost or OpenAI.