

Archive position — measured, not model output
1 like on Devpost
505 of the 7,850 archived projects have more likes, and 1,758 share exactly 1 — so this project's #1,993 place in the like-ranked listing is a tie-break inside that group, not a ranking.
Projects (log scale)
Likes on Devpost. ▲ marks this project's group.
Show the figures
| Likes | Projects | Share of archive |
|---|---|---|
| 0 | 5,587 | 71.2% |
| 1 | 1,758 | 22.4% |
| 2 | 284 | 3.6% |
| 3–4 | 132 | 1.7% |
| 5–9 | 75 | 1.0% |
| 10+ | 14 | 0.2% |
 User Stories BotA demo video on every pull request
Get a demo video on every new feature
GitHub App that watches your pull requests and records a narrated, captioned demo.
Save time on demo prep and make informed decisions faster with a video walkthrough of every new feature.
Executive Summary
What the company appears to be
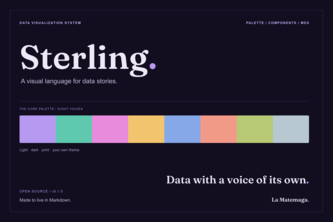
Sterling is an open-source toolkit for building consistent, publication-ready data stories across web, dark mode, and print. It provides a React/MDX-based system with 28 visualization types, reusable components, and support for light/dark/print modes. The project was built by one person (Cynthia Castillo), using AI tools like GPT-5.6 and Claude Opus as implementation collaborators.
What changed
The author describes Sterling as a response to recurring challenges in publishing data visualizations — specifically, the lack of reusable, consistent editorial systems that preserve statistical meaning while enabling sharing across platforms. It represents an evolution from manual chart creation toward a structured, systematized approach to storytelling with data.
Single most important open question
Is there evidence of adoption or usage beyond the author’s own testing and demonstration? The description does not indicate any external users, customers, or traction — only self-reported development and internal use.
Note: This analysis is based entirely on the self-reported project description provided by the author. No independent verification or historical data exists for this project.
What The Product Actually Is
- The description states that Sterling is an open-source palette and plug-and-play React/MDX figure system for data stories.
- It includes:
- A reusable
SterlingFigureshell for titles, subtitles, legends, sources, attribution, and responsive widths. - 28 D3/SVG visualization primitives (e.g., bars, scatterplots, violins, correlograms, dendrograms, Manhattan plots, expression matrices, maps).
- Light, dark, and print-aware palettes with customizable ramps.
- Features such as image copy, PNG export, mobile-native sharing, and CSV export of processed data rows.
- Localized UI in English/Spanish and accessible chart labels.
- A reusable
Inference: The system is built using React, MDX, D3, SVG, CSS custom properties, TypeScript, and R scripts for data transformation. It integrates with npm and supports package installation.
Positioning & Claim Evolution
- The author positions Sterling as a tool to solve the gap between finding interesting data and publishing it in a consistent, shareable way.
- Key claims:
- “A blog should not need to reinvent its visual language every time it publishes data.”
- “Sterling is my attempt to make those requirements feel editorial rather than bureaucratic.”
- “It brings source, attribution, sharing, and processed data into the figure itself instead of treating them as afterthoughts.”
Inference: The positioning evolved from a personal problem-solving effort (during YouTube live series) into a structured system aimed at improving reproducibility, consistency, and usability in data storytelling.
Target Customer & ICP
- Not evidenced.
- The description does not identify specific customer segments or personas.
- It is implied that the target audience includes data visualization engineers, researchers, content creators, or analysts who publish visualizations regularly.
- However, no explicit segmentation or buyer persona is described.
Absence of evidence: No stated ICP, customer types, or use cases beyond the author’s own workflow.
Business Model & Pricing Evidence
- Not evidenced.
- The project is described as open-source and published on npm.
- There is no mention of monetization, pricing tiers, subscriptions, or paid features.
- No indication of whether Sterling will ever be commercialized or if there are plans for a freemium model.
Absence of evidence: No business model or pricing information provided.
Technical & Delivery Signals
- Built with:
- React, MDX, D3, SVG, CSS custom properties, TypeScript
- R scripts for data transformation
- Node.js, npm, GitHub Actions, Vite
- AI tools: GPT-5.6 (Sol High and Terra High), Claude Opus 4.8, OpenAI Codex
- Uses:
- GitHub for version control
- Lucide React icons
- Tailwind CSS
- TopoJSON, HTML-to-image, JSON, Web Share API
- Delivered as an npm package with documentation and smoke tests
- Supports localization (English/Spanish), accessibility features, and export fidelity
Claim: The system is designed for portability and reusability across platforms and tools.
Traction & Maturity Signals
- Not evidenced.
- No mention of downloads, user engagement, or adoption metrics.
- The author describes a solo development process and internal testing.
- A small consumer smoke test is mentioned but not quantified.
- No evidence of external users, feedback loops, or product iteration history.
Absence of evidence: No traction data, customer base, or usage statistics available.
Competitive Context
- Not evidenced.
- The description does not reference competitors or similar tools in the space.
- It is unclear how Sterling compares to existing open-source or commercial visualization libraries (e.g., D3.js, Plotly, Tableau, Power BI, Matplotlib).
- No discussion of market positioning or differentiation.
Absence of evidence: No competitive landscape or comparison data provided.
Open Questions & Risks
- Solo development risk: The project is built by a single individual (Cynthia Castillo), which raises concerns about long-term maintenance, scalability, and support.
- AI dependency: Heavy reliance on AI tools for implementation may create fragility if those tools change or become unavailable.
- Open-source sustainability: As an open-source tool, there is no clear path to monetization or funding, which could limit future development.
- Lack of adoption evidence: Without external usage or feedback, it's unclear whether Sterling addresses a real market need or solves a problem widely felt by others.
Inference: The lack of traction and customer validation suggests early-stage uncertainty around product-market fit.
Questions the description leaves open
- What specific problems are you trying to solve for users beyond your own workflow?
- Have you received any feedback from other developers or data professionals who have tried Sterling?
- How do you plan to sustain development and maintenance of the project long-term?
- Are there any plans to monetize or commercialize Sterling in the future?
- What are the key technical challenges that remain unresolved or under-tested?
- How does Sterling handle edge cases in data visualization (e.g., missing values, outliers)?
- Is there a roadmap for expanding chart types or integrating with other ecosystems (R, Python, etc.)?
Overall Assessment
- Not evidenced.
- No financials, funding rounds, or valuation data are available.
- The project is described as open-source and self-funded by one person.
- There is no indication of strategic partnerships, investor interest, or commercial traction.
Conclusion: Based on the provided description, Sterling appears to be a personal project addressing an author’s own needs in data visualization. It lacks evidence of market demand, adoption, or business viability. Any potential investment or partnership would require further due diligence into usage, user feedback, and scalability beyond the creator's current scope.
User Stories BotA demo video on every pull request
Get a demo video on every new feature
GitHub App that watches your pull requests and records a narrated, captioned demo.
Save time on demo prep and make informed decisions faster with a video walkthrough of every new feature.
Source
Submitted to the OpenAI 2026 hackathon on Devpost. Project home on Devpost. Back to the full gallery on Devpost.
This competitive analysis was produced by top-founders.com (opens in a new tab)
Generated by a language model from this project's public Devpost page — its tagline, the author's own write-up and any built-with tags listed there — as captured in August 2026. Short quotations are the author's words. It is an opinion on the idea as a business, not on the people behind it, and it reflects the description as published then. If the project has moved on, request a correction below. The analysis is not independent research and contains no verified traction, revenue or customer data.
An independent guide by KFG International LLC — not affiliated with, endorsed by, or connected to Devpost or OpenAI.