

Archive position — measured, not model output
0 likes on Devpost
2,263 of the 7,850 archived projects have more likes, and 5,587 share exactly 0 — so this project's #3,991 place in the like-ranked listing is a tie-break inside that group, not a ranking.
Projects (log scale)
Likes on Devpost. ▲ marks this project's group.
Show the figures
| Likes | Projects | Share of archive |
|---|---|---|
| 0 | 5,587 | 71.2% |
| 1 | 1,758 | 22.4% |
| 2 | 284 | 3.6% |
| 3–4 | 132 | 1.7% |
| 5–9 | 75 | 1.0% |
| 10+ | 14 | 0.2% |
 User Stories BotA demo video on every pull request
Get a demo video on every new feature
GitHub App that watches your pull requests and records a narrated, captioned demo.
Save time on demo prep and make informed decisions faster with a video walkthrough of every new feature.
Executive Summary
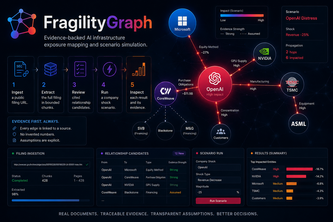
The description states that FragilityGraph is a tool for mapping and simulating financial exposures in SEC filings using AI. It accepts public filing URLs, processes them into chunks, and translates claims into relationship candidates. The system allows users to run scenario simulations that propagate through a graph structure, with results traceable back to source evidence or assumptions. The authors describe building it as an "evidence-backed" tool that avoids inventing missing data.
The project appears to be a proof-of-concept or prototype built for a hackathon, not yet a commercial product. It has no demonstrated traction, revenue, customers or market adoption. The most important open question is whether this concept can scale beyond a hackathon prototype into a viable commercial offering that financial analysts would pay for.
What The Product Actually Is
The description states that FragilityGraph:
- Accepts public filing URLs as input
- Returns full documents in bounded chunks
- Translates supported claims into cited relationship candidates
- Builds a trusted graph structure from filings
- Allows running company shock scenarios that propagate through the graph
- Provides traceability of results back to source evidence or declared assumptions
- Features a "review-before-trust" workflow and "evidence desk"
- Uses GPT-5.6 and Codex for development assistance
The system is described as having a FastAPI backend and Next.js frontend, with a financial-terminal-styled interface.
Positioning & Claim Evolution
The description states that the authors were inspired by the brittleness of current financial research processes where analysts lose track of material relationships in SEC filings. They aimed to turn filings into a graph that could be "clicked through and stress tested" rather than creating another summarization tool.
The positioning is described as an "evidence-backed AI infrastructure exposure mapping and scenario simulation" tool for SEC filings, targeting financial analysts who need to trace relationships and stress-test companies.
Target Customer & ICP
The description states that the tool targets financial analysts who work with SEC filings and need to:
- Find material relationships in 100+ page documents
- Trace exposures when companies are stressed
- Inspect and validate relationships before trusting them
- Run scenario simulations through company graphs
The authors note they built it for "exactly that kind of inspection" but do not specify the exact analyst role or firm type.
Business Model & Pricing Evidence
Not evidenced. The description does not state any pricing model, monetization strategy, or business model details beyond the self-reported project scope.
Technical & Delivery Signals
The description states:
- Built with FastAPI backend and Next.js frontend
- Uses GPT-5.6 and Codex for development assistance
- Extraction pipeline uses bounded, overlapping chunking instead of naive character cutoff
- Data is not added to trusted graph without human oversight
- Features "review-before-trust" workflow and evidence desk
- Includes scenario propagation animation
- Deployment on Neon, Render, and Vercel
- Uses technologies including: api, codex, css, fastapi, flow, gpt-5.6, neon, next.js, openai, postgresql, pydantic, pymupdf, python, rapidfuzz, react, sqlalchemy, tailwind, typescript, vercel
Traction & Maturity Signals
Not evidenced. The description states this was built for a hackathon and contains no information about revenue, customers, usage metrics, or product maturity beyond the prototype stage.
Competitive Context
Not evidenced. The description does not mention any existing competitors or market positioning relative to other financial analysis tools or SEC filing platforms.
Open Questions & Risks
- The project is described as a hackathon submission with no demonstrated traction
- No evidence of revenue, customers or commercial adoption
- The authors state they never filled missing values with invented numbers, which may limit practical utility
- The tool appears to be built for a specific use case (SEC filings) rather than broader financial analysis needs
- The "evidence-backed" approach may make it less flexible for exploratory analysis
Questions the description leaves open
- What is the actual market need you're solving for beyond hackathon demonstration?
- Have you validated this with actual financial analysts or firms?
- How do you plan to scale beyond the current prototype approach?
- What are your plans for monetization and pricing?
- What specific SEC filing types will you support, and how does that map to real-world demand?
- How do you handle edge cases in document processing and relationship mapping?
- What is your roadmap for product development beyond this prototype?
Overall Assessment
Not evidenced. The description contains no information about funding rounds, valuation, or investment status beyond the hackathon submission. No commercial due-diligence signals are present to assess viability for investment or partnership.
User Stories BotA demo video on every pull request
Get a demo video on every new feature
GitHub App that watches your pull requests and records a narrated, captioned demo.
Save time on demo prep and make informed decisions faster with a video walkthrough of every new feature.
Source
Submitted to the OpenAI 2026 hackathon on Devpost. Project home on Devpost. Back to the full gallery on Devpost.
This competitive analysis was produced by top-founders.com (opens in a new tab)
Generated by a language model from this project's public Devpost page — its tagline, the author's own write-up and any built-with tags listed there — as captured in August 2026. Short quotations are the author's words. It is an opinion on the idea as a business, not on the people behind it, and it reflects the description as published then. If the project has moved on, request a correction below. The analysis is not independent research and contains no verified traction, revenue or customer data.
An independent guide by KFG International LLC — not affiliated with, endorsed by, or connected to Devpost or OpenAI.