

Archive position — measured, not model output
0 likes on Devpost
2,263 of the 7,850 archived projects have more likes, and 5,587 share exactly 0 — so this project's #3,536 place in the like-ranked listing is a tie-break inside that group, not a ranking.
Projects (log scale)
Likes on Devpost. ▲ marks this project's group.
Show the figures
| Likes | Projects | Share of archive |
|---|---|---|
| 0 | 5,587 | 71.2% |
| 1 | 1,758 | 22.4% |
| 2 | 284 | 3.6% |
| 3–4 | 132 | 1.7% |
| 5–9 | 75 | 1.0% |
| 10+ | 14 | 0.2% |
 User Stories BotA demo video on every pull request
Get a demo video on every new feature
GitHub App that watches your pull requests and records a narrated, captioned demo.
Save time on demo prep and make informed decisions faster with a video walkthrough of every new feature.
Executive Summary
What the company appears to be
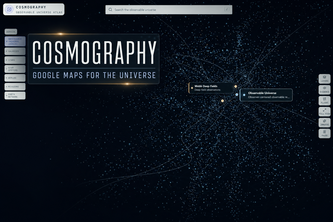
Cosmography is an interactive, observer-centered atlas of the known universe, built as a web application. The author describes it as a "Google Maps for the universe" that unifies data from space agencies and research institutions into one intelligent and interactive place. It currently presents a prototype with seven exploration scales, from the Observable Universe down to planetary surface views, using official imagery and scientific sources.
What changed
The project is in early development phase, representing a prototype built by a single developer (Byron krepcho) over a short timeframe. It was submitted as part of the OpenAI 2026 hackathon and is described as only 30% complete toward its long-term vision.
The single most important open question
Is there sufficient commercial traction, customer demand or market validation to justify further investment or partnership consideration? The description contains no evidence of revenue, customers, user engagement metrics, or product-market fit beyond the author's own claims and prototype demonstration.
What The Product Actually Is
The description states that Cosmography is an interactive, observer-centered atlas of the known universe. It presents a prototype with:
- An interactive Observable Universe opening view
- A guided journey through seven scales (Observable Universe to Jezero Crater)
- A Solar System scene with Sun and eight planets
- An interactive Mars experience using official imagery
- Three recorded Jezero rover panorama stations
- A ten chapter Voyager 1 mission experience
- Search across a verified foundation catalog
- Evidence panels showing sources, agencies, transformations, and uncertainty
- An Earth exploration network representing 35 sites from 28 organizations
- Reference experiences for Apollo 17, Flight Deck concepts, and the Black Hole Lab
The product is described as a TypeScript and React web application using Three.js and WebGL2 for 3D visualization. It uses Cloudflare Worker-compatible architecture with D1 and R2 for data storage.
Positioning & Claim Evolution
The author states that Cosmography began as an idea inspired by the lack of "Google Maps for the known universe" and aims to bring together scattered space knowledge into one intelligent and interactive place. The positioning evolved from a simple prototype to a long-term vision of a "living map" where users can explore from universal views down to specific missions, planets, moons, landscapes, and recorded locations while keeping scientific evidence attached.
The author claims that instead of reading about missions on isolated pages, people should be able to open them on the map, follow their journeys, visit recorded stops, view connected imagery and discoveries, and understand how they fit into humanity's larger exploration story. This represents a shift from static information presentation to interactive exploration.
Target Customer & ICP
The description states that Cosmography is designed to help people, especially children and students, explore what humanity knows about space and remain curious about what's still waiting to be discovered. The author specifically mentions wanting to reignite curiosity about space and make collected knowledge easier for everyone to explore, particularly targeting children and students.
No explicit customer segments beyond this general audience are identified in the description.
Business Model & Pricing Evidence
Not evidenced. The description does not contain any information about pricing models, monetization strategies, revenue streams or business model details.
Technical & Delivery Signals
The application is built as a TypeScript and React web application using:
- Three.js and WebGL2 for 3D visualization
- Vite, Vinext, Tailwind CSS, Zod, Drizzle for structure and data layer
- Cloudflare Worker-compatible environment with D1 and R2 for storage
- Integration of official scientific sources including NASA, JPL, USGS Astrogeology, NAIF SPICE, JPL Horizons, NASA PDS, Gaia DR3, etc.
The author used GPT 5.6 and Codex as development tools throughout the project, though these are not presented as embedded features in the current prototype.
Traction & Maturity Signals
Not evidenced. The description contains no evidence of revenue, customers, user engagement metrics, or product-market fit beyond the author's own claims and prototype demonstration. The author states that the current prototype represents only about 30% of what they ultimately want Cosmography to become and that it is a long-term project requiring significant development time.
Competitive Context
Not evidenced. The description does not contain any information about competitors, market positioning relative to existing solutions, or competitive landscape analysis.
Open Questions & Risks
- Single-founder risk: The entire project was built by one person (Byron krepcho), indicating high founder dependency and potential scalability issues
- Unproven commercial viability: No evidence of revenue, customers or market traction beyond a prototype
- Resource constraints: The author notes significant challenges with development time, token usage, scientific review, data storage, and hosting resources
- AI dependency: Heavy reliance on GPT 5.6 and Codex as development tools rather than integrated product features
- Unclear path to monetization: No business model or pricing information provided
- Long-term vision vs. current reality: The prototype represents only 30% of the intended scope, suggesting significant development work remains
Questions the description leaves open
- What specific user feedback have you received from children and students who have used the prototype?
- How do you plan to address the substantial resource requirements for expanding beyond the current 30% implementation?
- What is your strategy for scientific accuracy verification given the complexity of space data?
- Have you identified any potential revenue streams or commercial partnerships that could support long-term development?
- What are the key technical challenges you anticipate in scaling from the current prototype to a full "living map"?
- How do you plan to handle the ongoing costs of maintaining and updating scientific data sources?
Overall Assessment
Not evidenced. The description contains no information about financial performance, customer traction, market validation or business metrics that would inform an investment or partnership decision. The project is described as a prototype built by one person with no evidence of commercial traction, revenue, or customer adoption. The author's own claims indicate this is still in early development phase and represents only 30% of the intended scope. No evidence exists to support any conclusion about commercial viability or investment potential.
User Stories BotA demo video on every pull request
Get a demo video on every new feature
GitHub App that watches your pull requests and records a narrated, captioned demo.
Save time on demo prep and make informed decisions faster with a video walkthrough of every new feature.
Source
Submitted to the OpenAI 2026 hackathon on Devpost. Project home on Devpost. Back to the full gallery on Devpost.
This competitive analysis was produced by top-founders.com (opens in a new tab)
Generated by a language model from this project's public Devpost page — its tagline, the author's own write-up and any built-with tags listed there — as captured in August 2026. Short quotations are the author's words. It is an opinion on the idea as a business, not on the people behind it, and it reflects the description as published then. If the project has moved on, request a correction below. The analysis is not independent research and contains no verified traction, revenue or customer data.
An independent guide by KFG International LLC — not affiliated with, endorsed by, or connected to Devpost or OpenAI.